Time series prediction has been widely applied to the finance industry in applications such as stock market price and commodity price forecasting. Machine learning methods have been widely used in financial time series prediction in recent years. How to label financial time series data to determine the prediction accuracy of machine learning models and subsequently determine final investment returns is a hot topic.
Introduction
A time series is a set of observations, each one being recorded at a specific time. Prediction of time series data is a relatively complex task. Since there are many factors affecting time series data, it is difficult to predict the trend of time series data accurately. Time series forecasting aims at solving various problems, specifically in the financial field.
Features and Labels
Making Features
The data for making features can be some financial reports, technical indicators, and there are many ways to make these indicators, but this will not be in the scale of this article.
Making Labels
Fixed-time Horizon Method
If the label is too difficult to predict, the model will not be trained effectively. In the past, the most basic way to create a label was to use a Fixed-time Horizon Method to predict the rise and fall after w time units.
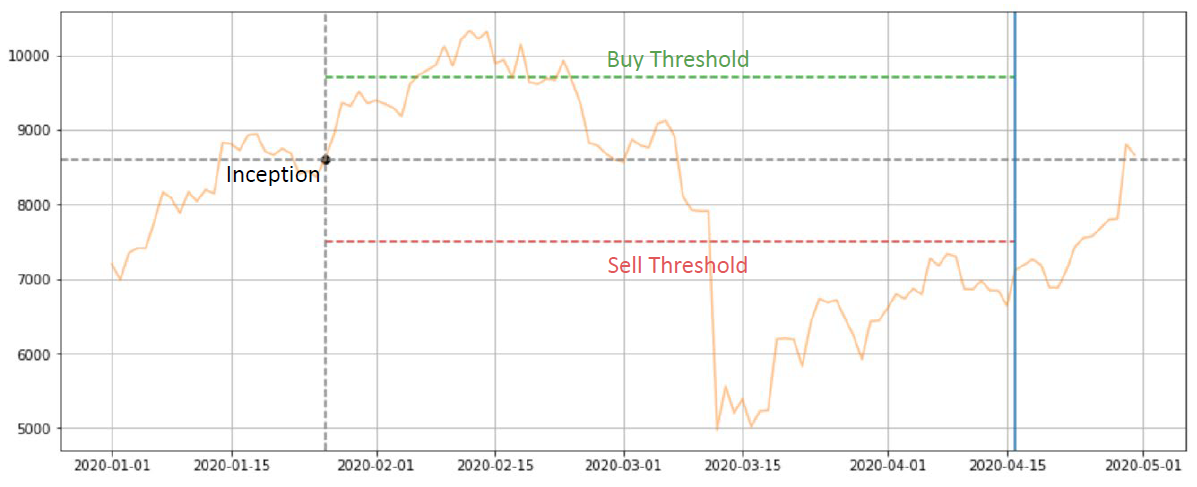
In the above graph at p(t), we want to predict whether the stock price at p(t+w) will be higher or lower. We can use the classification method to divide the rise and fall of the stock price into three parts, that is -1 (fall), 0 (no rise, no fall), 1 (rise), so that we can let the machine learn to predict, in the above figure, we can find that the stock price is higher than the previous one, so it is classified as 1, that is, it will rise afterwards.
However, there is a drawback to this approach, that is, when the model calls us to buy today, once we buy, we will hold for w time units, no matter the stock price rises or falls, we must continue to hold, no stop loss and stop profit, which will lead to uncontrolled risk. Of course, we can add stop-loss and stop-gain to the backtest, but that would be contrary to the original purpose of the model, as the label generated by the model is clearly holding w time units, without stop-loss and stop-gain.
To solve the above problem, Prado proposes the following new approach in his book Advances in Financial Machine Learning.
Triple Barrier Method
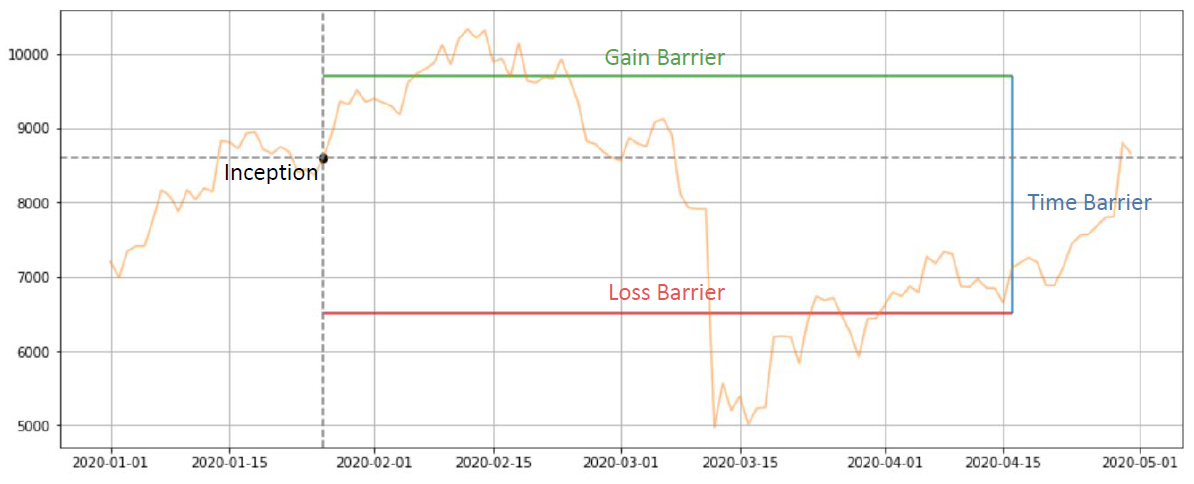
At first glance, it looks a bit similar to the fixed time horizon, but this method has improved the classification method a bit. In the above diagram, three different colored “bars” are used. When the price starts from p(t) and extends over time, it will definitely hit one of the three bars, and these three bars represent different meanings:
- 1 (profit take)
- 0 (holding w time units)
- -1 (stop loss)
In this way, we can allow machine learning model to predict “stop-loss” and “profit-take”, and the trained model can match the backtest settings, increasing the predictability of machine learning model!
Python Implementation
The use of this function is to input price, stop-loss, proft-take, and maximum holding time into triple_barrier(), and return ret dataframe. The three columns in the dataframe stand for:
- triple_barrier_profit: future profitability until the stop loss and stop profit
- triple_barrier_sell_time: the holding time
- triple_barrier_signal: triggered by stop loss and stop profit
def triple_barrier(data, column, ub=1.05, lb=0.97, max_period=20):
    """
    Parameters
    ----------
    data: pd.DataFrame
        A dataframe contains open, high, low, close columns.
    column: str
        Select the column in order to generate triple barrier signal.
    ub: float, default=1.05
        The upper bound represents profit-take.
    lb: float, default=0.97
        The lower bound represents stop-loss.
    max_period: int, default=20
        Time interval between current time and time of vertical barrier.

    Examples
    --------
        >>> data = yf.download("AAPL", progress=False)
        >>> ret = triple_barrier(data.Close, 1.05, 0.97, 10)
    """
    def end_price(s):
        return np.append(s[(s / s[0] > ub) | (s / s[0] < lb)], s[-1])[0]/s[0]

    r = np.array(range(max_period))

    def end_time(s):
        return np.append(r[(s / s[0] > ub) | (s / s[0] < lb)], max_period-1)[0]

    price = data[column]
    p = price.rolling(max_period).apply(end_price, raw=True).shift(-max_period+1)
    t = price.rolling(max_period).apply(end_time, raw=True).shift(-max_period+1)
    t = pd.Series([t.index[int(k+i)] if not math.isnan(k+i) else np.datetime64('NaT')
                   for i, k in enumerate(t)], index=t.index).dropna()

    signal = pd.Series(0, p.index)
    signal.loc[p > ub] = 1
    signal.loc[p < lb] = -1
    ret = pd.DataFrame({'triple_barrier_profit': p,
                        'triple_barrier_sell_time': t,
                        'triple_barrier_signal': signal})
    return ret
This labeling method seems performing super well.
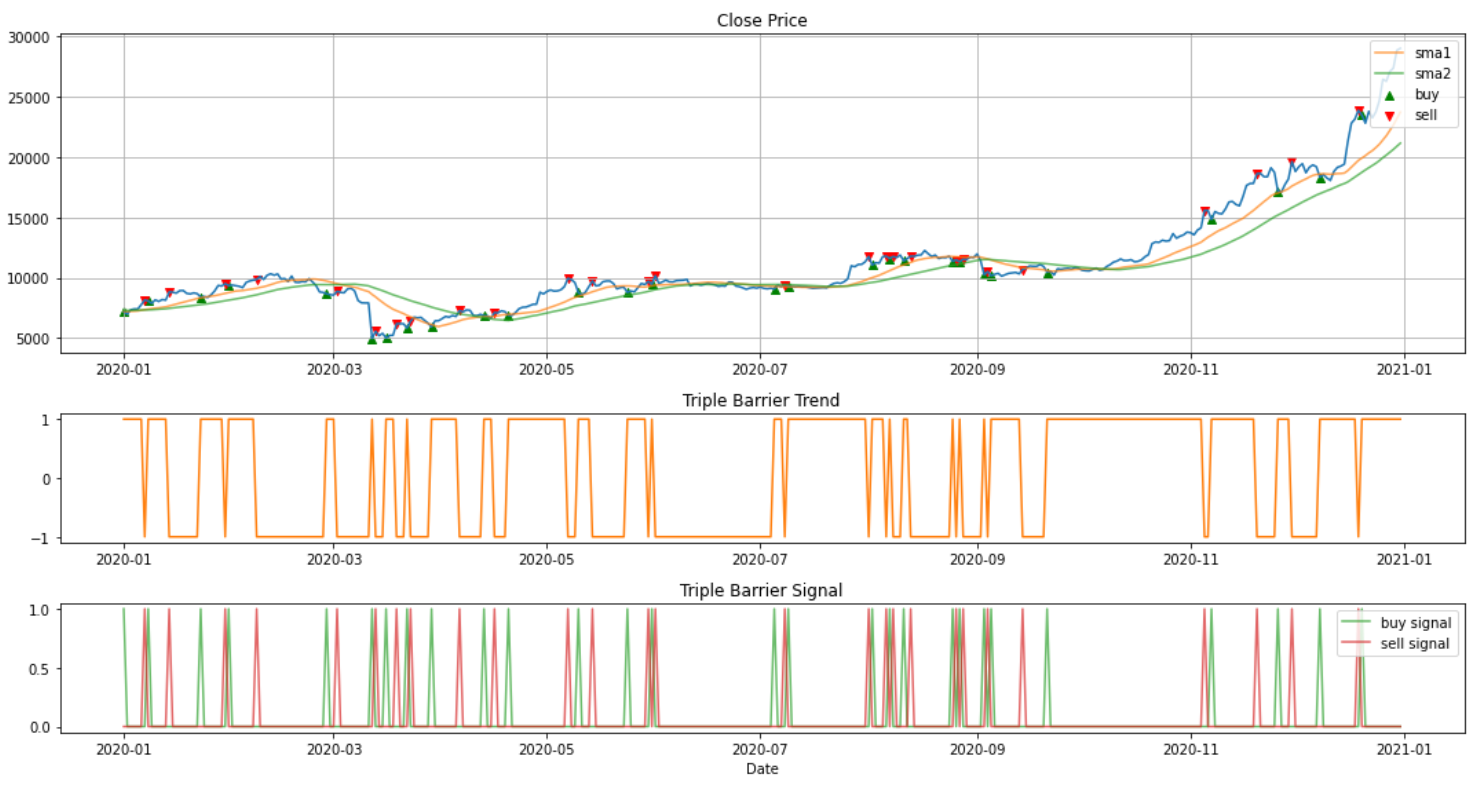
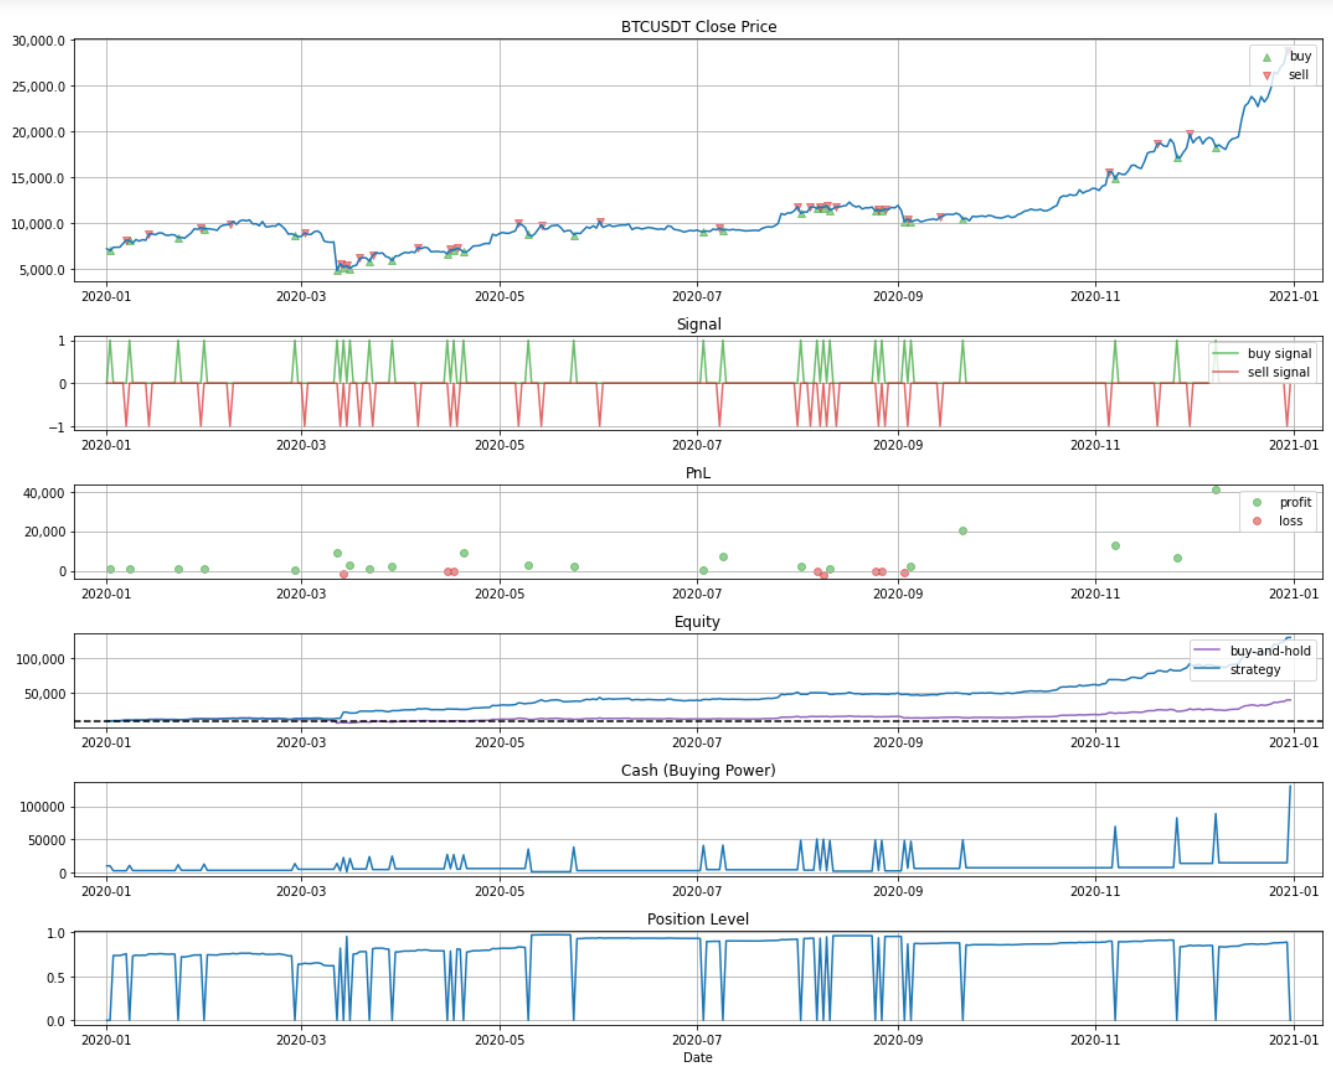
I also implement a backtest function to see whether Triple Barrier Method can make profit. Let’s see if the model performs well while backtesting.
Conclusion
In today’s article, we looked at implementing a basic model using the Triple Barrier Method. Next time, I’ll discuss how to train machine learning model based on this auto labeling method. Stay tuned!