Introduction
The dream of early retirement. Most people are not able to do so. Therefore, we should do a good job of financial planning while we are young. It is not impossible to make a lot of profit from investments. In essence, there are two methods to do investment, fundamental analysis and technical analysis. Fundamental analysis considers all the factors that affect a company’s financial and profitability factors. Technical analysis side is to look at the line chart, indicators, etc. However, in this article, I will only talk about technical analysis, and fundamental analysis is out of scope.
Fundamental Analysis VS Technical Analysis
In investing, there are two broad ways to determine how to trade: technical analysis and fundamental analysis. Many novice investors may have heard of these two terms, but what do they really mean? And how should they be used?
Fundamental Analysis
Purpose of Fundamental Analysis is to find out the true value of a investment target in the future. Fundamental analysts study everything from the overall economy and industry conditions to the financial strength and management of individual companies.
Technical Analysis
Technical analysis differs from fundamental analysis, in that traders attempt to identify opportunities by looking at statistical trends, such as movements in a stock’s price and volume. The core assumption is that all known fundamentals are factored into price, thus there is no need to pay close attention to them. Technical analysts do not attempt to measure a security’s intrinsic value. Instead, they use stock charts to identify patterns and trends that suggest what a stock will do in the future.
Popular technical analysis signals include simple moving averages (SMA), support and resistance levels, trendlines and momentum indicators, which are the highlights of this article.
To put it simply, fundamental analysis is to analyze how much this thing is worth, and has nothing to do with how much it will eventually sell for, while technical analysis is to analyze how much this thing can sell for at the moment, and it has nothing to do with how much it is worth.
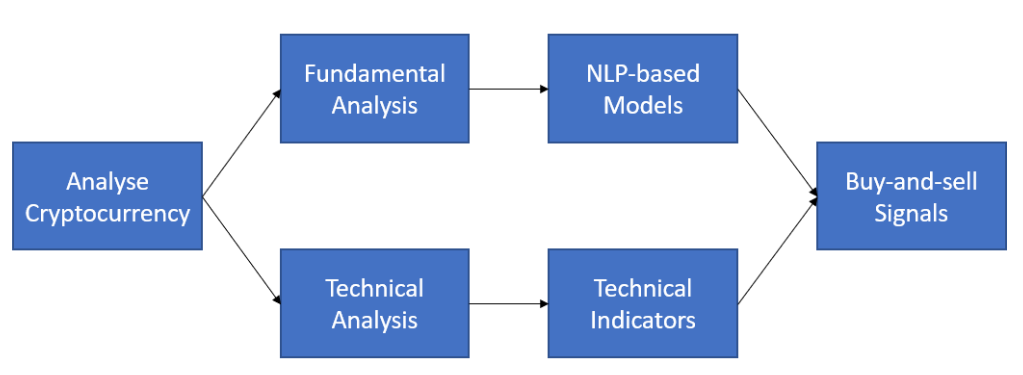
In general, when investing, technical analysis or fundamental analysis is used for stock selection. In my MSc dissertaion, I propose a strategy that combines both, which tells investors that they do not have to choose between technical analysis and fundamental analysis. Take cryptocurrency for example, to study whether a cryptocurrency is worth investing in, it is crucial to understand not only fundamental analysis but also technical analysis. The aim of my dissertation project is to develop a classifier for buy-and-sell signals using textual data and technical indicators for fundamental analysis and technical analysis, respectively, to mimic the behavior of an actual person who is interested in investment.
Technical Indicators
It can be helpful to use technical analysis as part of our strategy, and this includes studying various trading indicators. Trading indicators are mathematical calculations, which are plotted as lines on a price chart and can help traders identify certain signals and trends within the market.
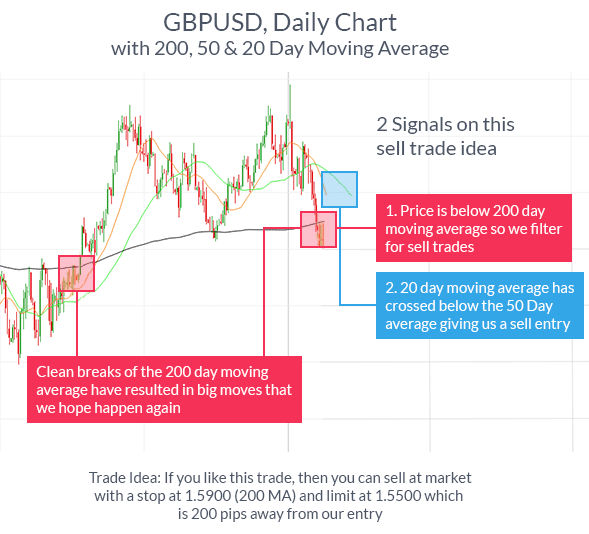
Moving Average (MA)
Moving Average (MA) is an indicator used to identify the direction of a current price trend, without the interference of shorter-term price spikes. The MA indicator combines price points of a financial instrument over a specified time frame and divides it by the number of data points to present a single trend line.
The formula for simple moving average is
where
Exponential Moving Average (EMA)
EMA is another form of moving average. Unlike the SMA, it places a greater weight on recent data points, making data more responsive to new information. The formula for calculating the EMA is a matter of using a multiplier and starting with the SMA.
where
- t = today
- y = yesterday
- N = number of days in EMA
- k =
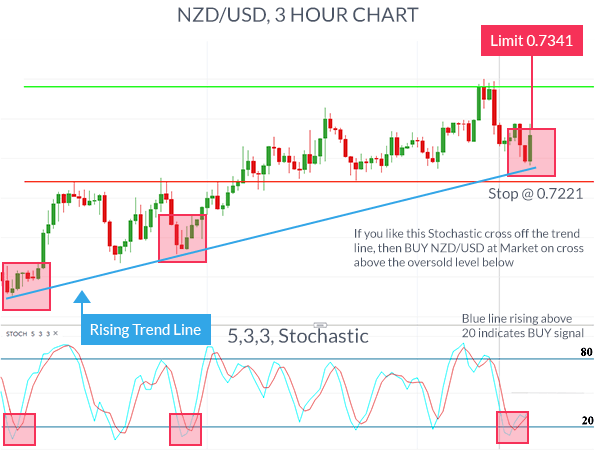
Stochastic Oscillator
A stochastic oscillator is an indicator that compares a specific closing price of an asset to a range of its prices over time – showing momentum and trend strength. It uses a scale of 0 to 100. A reading below 20 generally represents an oversold market and a reading above 80 an overbought market. However, if a strong trend is present, a correction or rally will not necessarily ensue.
The formula for the stochastic oscillator is
where
- C = most recent closing price
= the lowest price traded of the n look-back period = the highest price traded during the same n look-back period - %K = the current value of the stochastic indicator
- %D = 3-period SMA of %K
Notably, %K is referred to sometimes as the fast stochastic indicator. The “slow” stochastic indicator is taken as %D = 3-period moving average of %K. The stochastic oscillator is range-bound, meaning it is always between 0 and 100. This makes it a useful indicator of overbought and oversold conditions. Traditionally, readings over 80 are considered in the overbought range, and readings under 20 are considered oversold.
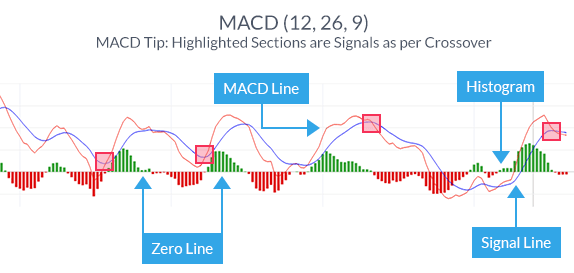
Moving Average Convergence Divergence (MACD)
MACD is an indicator that detects changes in momentum by comparing two moving averages. It can help traders identify possible buy and sell opportunities around support and resistance levels. ‘Convergence’ means that two moving averages are coming together, while ‘divergence’ means that they’re moving away from each other. If moving averages are converging, it means momentum is decreasing, whereas if the moving averages are diverging, momentum is increasing.
- MACD Line: (12-day EMA - 26-day EMA)
- Signal Line: 9-day EMA of MACD Line
- MACD Histogram: MACD Line - Signal Line
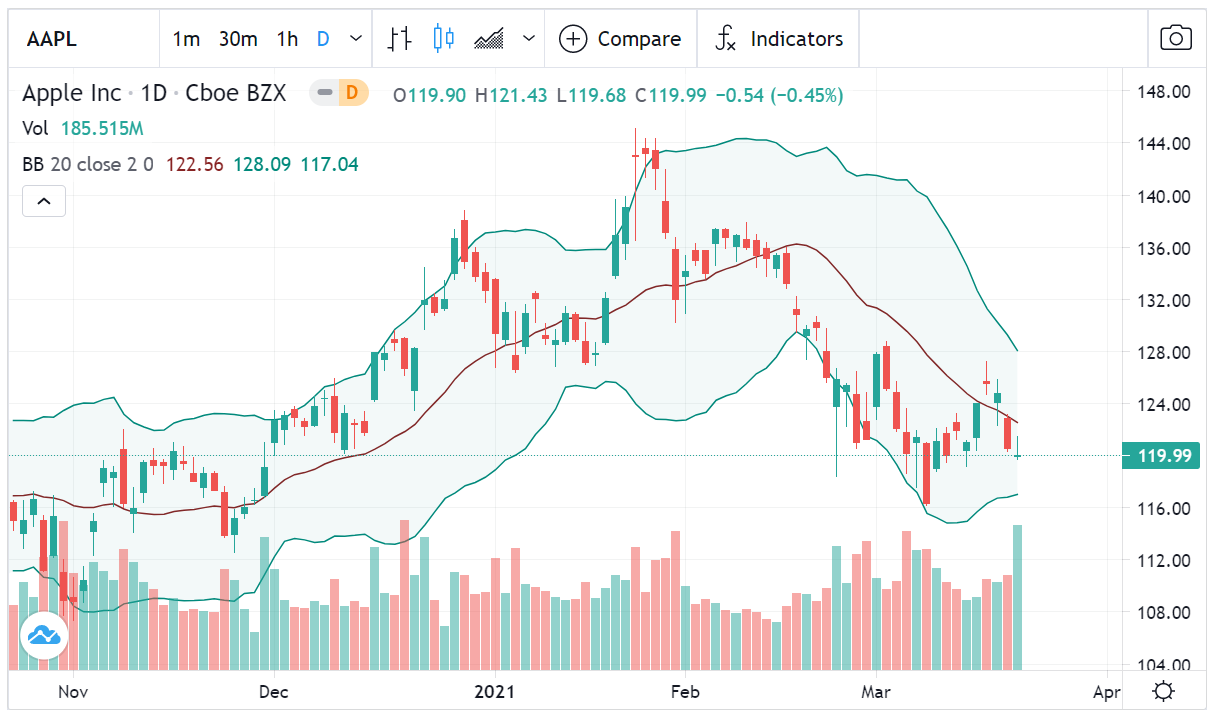
Bollinger Bands
A Bollinger band is an indicator that provides a range within which the price of an asset typically trades. The width of the band increases and decreases to reflect recent volatility. The closer the bands are to each other – or the ‘narrower’ they are – the lower the perceived volatility of the financial instrument. The wider the bands, the higher the perceived volatility.
- Middle Band = 20-day simple moving average (SMA)
- Upper Band = 20-day SMA + (20-day standard deviation of price x 2)
- Lower Band = 20-day SMA - (20-day standard deviation of price x 2)
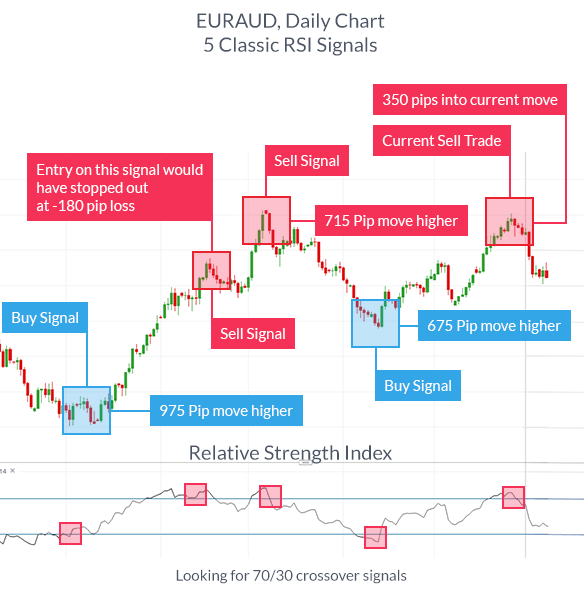
Relative Strength Index (RSI)
The relative strength index (RSI) is a momentum indicator used in technical analysis that measures the magnitude of recent price changes to evaluate overbought or oversold conditions in the price of a stock or other asset. Traditional interpretation and usage of the RSI are that values of 70 or above indicate that a security is becoming overbought or overvalued and may be primed for a trend reversal or corrective pullback in price. An RSI reading of 30 or below indicates an oversold or undervalued condition.
where RS stands for Relative Strength, which is the ratio of the average ‘Up’ closes to the average of ‘Down’ closes over ‘N’ periods.
Difference between RSI and Stochastic Oscillator
Both RSI and Stochastic Oscillator are momentum indicators in technical analysis. In fact, they are two of the most popular oscillators in the field. Both have similar uses, but their mathematical basis is different. RSI considers the quotient of the average gain and average loss over a certain period of time, while stochastic oscillator measures the closing price relative to the high and low over a certain time frame.
In order to get more visible trading signals, some traders choose to use the RSI and stochastic oscillator in combination. While the signals from these two indicators point to different angles, the combination can help traders better determine market trends. It is important to note that there are similarities between the indicators and that using them in combination will not necessarily provide stronger trading signals.
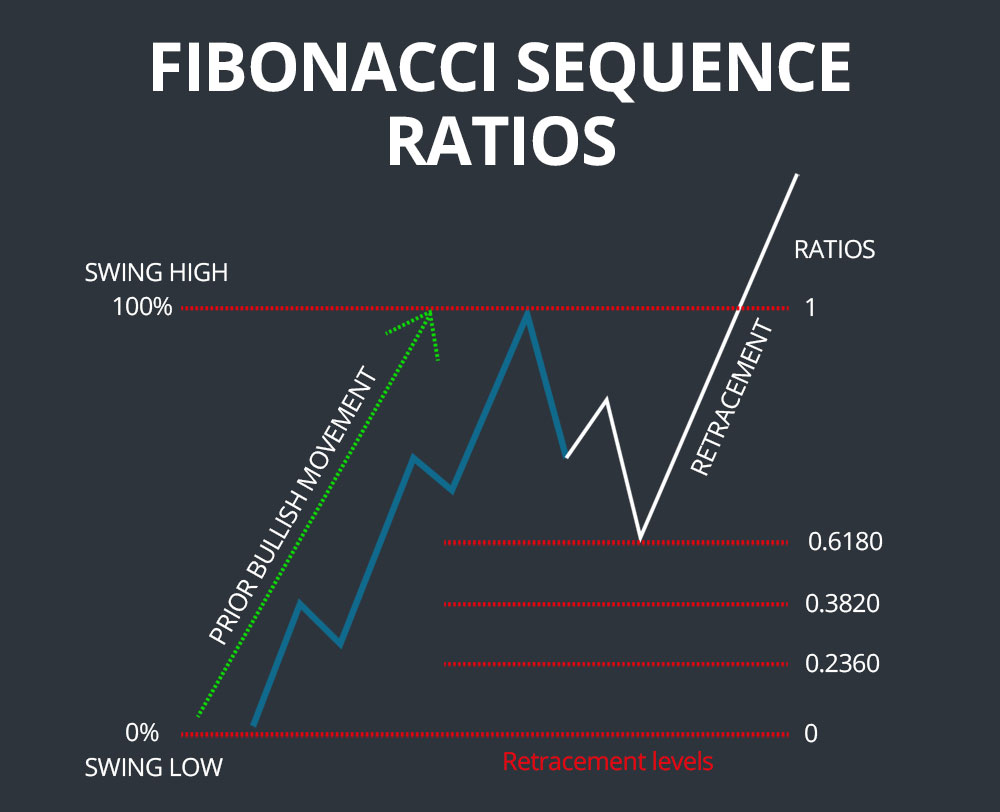
Fibonacci Retracement
Fibonacci retracement is an indicator that can pinpoint the degree to which a market will move against its current trend. A retracement is when the market experiences a temporary dip – it is also known as a pullback.
Traders who think the market is about to make a move often use Fibonacci retracement to confirm this. This is because it helps to identify possible levels of support and resistance, which could indicate an upward or downward trend. Because traders can identify levels of support and resistance with this indicator, it can help them decide where to apply stops and limits, or when to open and close their positions.
Leonardo Pisano Bogollo (1170-1250), an Italian mathematician from Pisa, is credited with introducing the Fibonacci sequence to the West. It is as follows:
0, 1, 1, 2, 3, 5, 8, 13, 21, 34, 55, 89, 144, 233, 377, 610 …
There is a mathematical relationship between the numbers in the series and the corresponding ratios are generated, which are then plotted in a table. These ratios are
- 0%
- 23.6%
- 38.2%
- 61.8%
- 78.6%
- 100%
All but the first few digits at the last digit give a value close to 0.618, e.g. if you divide 21 by 34 you get 0.6176. If you divide the current digit at the last two digits you get 0.382. e.g. if you divide 21 by 55 you get 0.3818. All ratios in the Fibonacci Retracement tool (except for 50%) are designed for this calculation.
In an uptrend, the low will be 1 (100%) and the high will be 0 (0%). By drawing Fibonacci retracement lines in an uptrend, traders can understand the possible support levels and test the results in a market retracement - hence the term retracement.
On the contrary, the low in a downtrend is 0 (0%) and the high is 1 (100%). In a downtrend, a reversal in this case would be an upward stretch from the bottom, i.e. a rebound. At this point, the Fibonacci reversion tool may mirror the resistance level during the market’s upward movement.
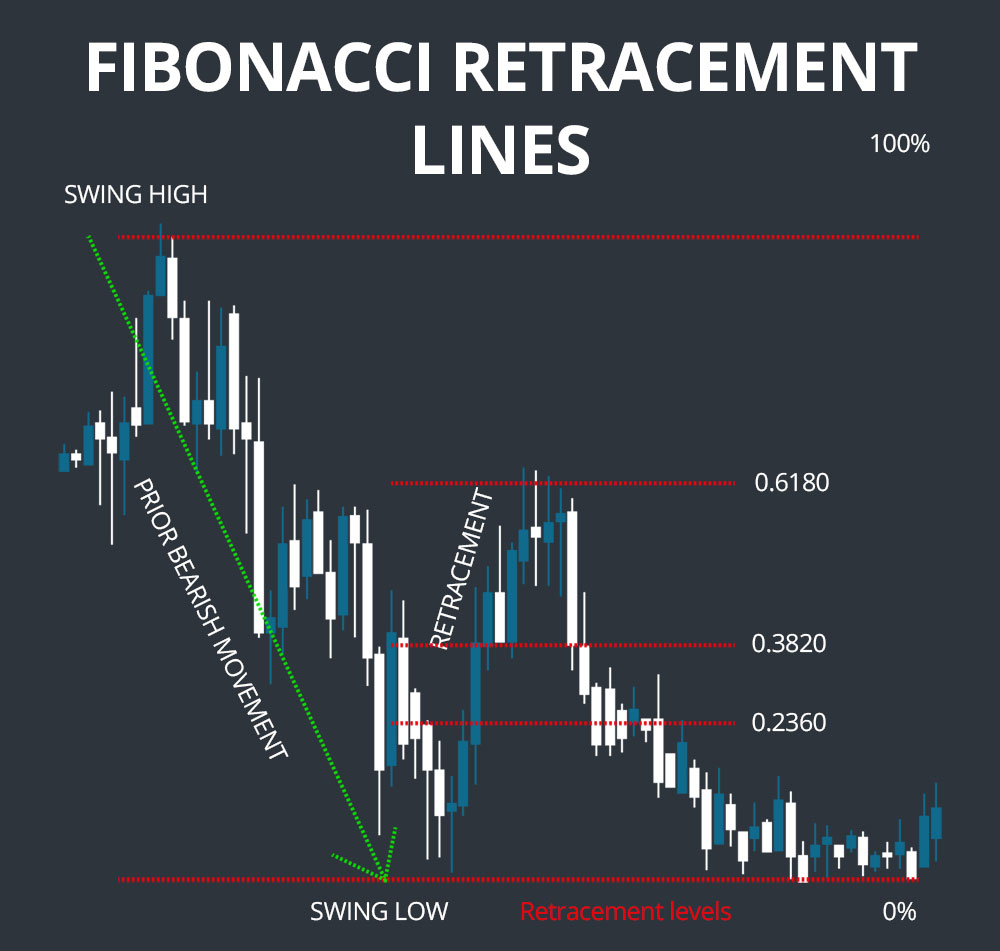
In finance, Fibonacci retracement is a method of technical analysis for determining support and resistance levels. They are named after their use of the Fibonacci sequence. Fibonacci retracement is based on the idea that markets will retrace a predictable portion of a move, after which they will continue to move in the original direction.
Conclusion
The first rule of using trading indicators is that you should never use an indicator in isolation or use too many indicators at once. Focus on a few that you think are best suited to what you’re trying to achieve. You should also use technical indicators alongside your own assessment of the movements of an asset’s price over time.
References
- https://school.stockcharts.com/doku.php?id=technical_indicators:stochastic_oscillator_fast_slow_and_full
- https://www.investopedia.com/terms/m/macd.asp
- https://www.ig.com/uk/trading-strategies/10-trading-indicators-every-trader-should-know-190604
- https://www.investopedia.com/ask/answers/122414/what-moving-average-convergence-divergence-macd-formula-and-how-it-calculated.asp
- https://school.stockcharts.com/doku.php?id=technical_indicators:bollinger_bands
- https://www.investopedia.com/terms/r/rsi.asp
- https://corporatefinanceinstitute.com/resources/knowledge/trading-investing/relative-strength-index-rsi/
- https://academy.binance.com/zt/articles/a-guide-to-mastering-fibonacci-retracement
- https://en.wikipedia.org/wiki/Fibonacci_retracement
- https://www.dailyfx.com/education/technical-analysis-tools/4-effective-trading-indicators-every-trader-should-know.html
- https://scanz.com/fibonacci-retracements-guide/